
Severely Increased Risk for Pedestrians and Cyclists
20 May 2021AccidentsRoad accident statistics are affected by all manner of different factors. This means that, in order to come up with measures to increase road safety, a highly nuanced approach that accounts for these factors and how they are interconnected is required. This chapter focuses on the analysis of accident statistics for older people in different regions around the world. The aim of this is to identify age-related risks so that the subsequent chapters can be used to develop approaches toward maintaining safe mobility for older people.
The available infrastructure, population com-position, financial means, attitudes towards both safety in general and road safety in particular – when it comes to road traffic, there are sometimes significant differences between different countries, and even within individual coun-tries and regions. For example, rural road traffic is considerably different to that in urban areas. When comparing towns and cities, the factors that play a key role include the availability of local public transport, the bicycle path network, and the topography. The results will also differ depending on which modes of transport are included in the analysis. Increasing safety for cyclists requires different concepts than for car occupants. At the same time, care must be taken to ensure that any measures introduced to increase the safety of one group of road users do not impede the safety of others. Another factor to consider is the reason why these different groups use the roads in the first place. Are they commuting to and from work? Going shopping? Transporting products and goods across short/long distances? Or traveling purely for leisure reasons?
Within the context of all these factors, it is also essential to consider the age of the road users. As people advance in age, their circumstances and mobility-related needs change. Increased life experience changes people’s attitudes towards risk acceptance and risky behavior, not to mention their ability to anticipate critical situations. The boundaries of what is physically and cognitively possible for them also shift. If we are to achieve the objective of increasing road safety for everyone while also meeting the individual mobility requirements for each age group, a highly nuanced approach and precise analyses will be required. Comparing accident statistics between various age groups is a suitable means of identifying the different – or even identical – weak points in how they use the roads.
Looking at absolute figures can only offer a limited insight when focusing on the age of the road user. In most countries, there is a lack of reliable age-related data on road use, i.e. on the routes taken with different means of transport, the time spent in road traffic, and the usage frequency of urban and rural roads and freeways. However, taking an age group as a percentage of the pop-ulation and considering it in relation to the frequency of accident involvement or the severity of injuries provides important indications of how relevant these statistics are within traffic events as a whole and for long-term changes.
STARK DIFFERENCES BETWEEN CONTINENTS
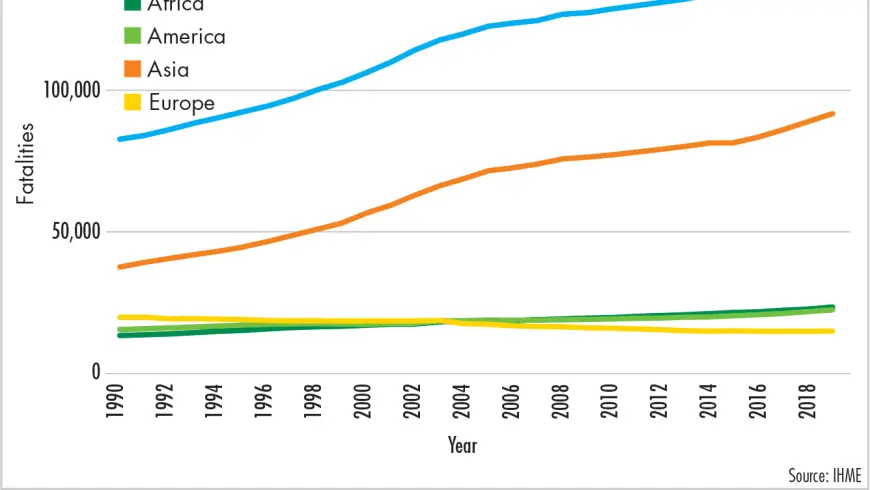
If we start from a global perspective and carefully examine the absolute figures, it is noticeable that, according to the Institute for Health Metrics and Evaluation (IHME) at the University of Washington in Seattle, the number of global traffic fatalities has stagnated in recent years at around 1.25 million – WHO estimates being as high as 1.35 million traffic fatalities. This stagnation is prevalent to the same degree on almost every continent. Although the number of traffic fatalities mainly decreased between 1990 and 2019, at least for road users aged 49 and under, there were significant increases in some of the demographics aged 50 and over. For example, according to the IHME, the number of 65 to 69-year-old road users killed globally in accidents increased by more than 65 percent between 1990 and 2019, from 39,000 to around 65,000. In Asia alone, the number doubled from 20,000 to more than 40,000.
INCREASING SAFETY FOR CYCLISTS REQUIRES DIFFERENT CONCEPTS THAN FOR CAR OCCUPANTS
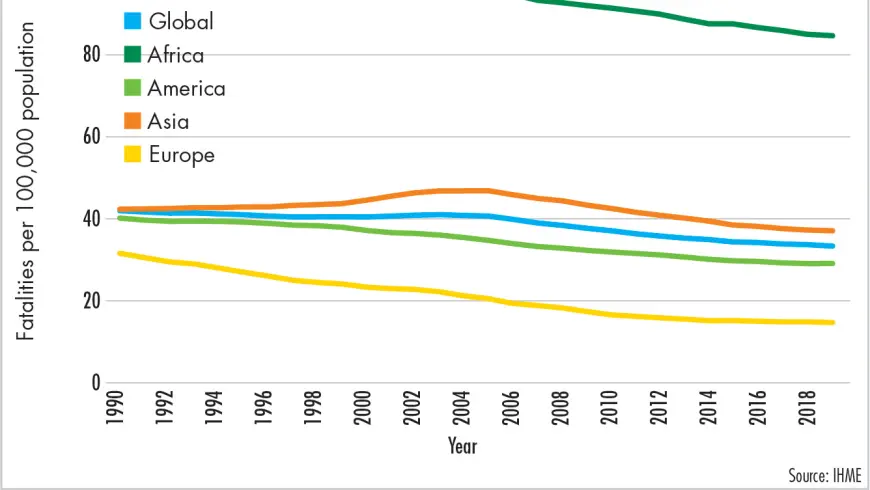
For people over the age of 70, the global rate of increase was over 80 percent – from 82,000 to just under 150,000. Once again, Asia makes up the lion’s share: in 2019, just under 92,000 people aged 70 or over there died in road traffic accidents – around two and a half times as many as in 1990. In terms of the number of fatalities for people over 70 per 100,000 population, Africa had over 80 fatalities in 2019, placing it far above the average figures for Asia (35), America (27) and Europe (13). Globally, this figure was 32 for the over-70s demographic. Things look considerably better for the other age groups in this context. For the 15 to 49-year-olds, around 16 people per 100,000 population died worldwide in road accidents in 2019, and 22 per 100,000 population for the 50 to 69-year-olds.
The number of fatalities in relation to the type of road user are also very revealing: globally, around 55 percent of the people over 70 who died due to road accidents in 2019 were pedestrians (approx. 82,500). Asia accounted for the majority of this number, with just under 56,000 (68 percent). The number of car occupants in this age group who died worldwide in 2019 was around 44,000, of whom just under 19,000 were in Asia alone. Most of the cyclists and motorcyclists who were killed – around 80 percent – were also in Asia.
The quoted figures may not be completely reliable on such a detailed scale, as some of them are merely estimates, as stated in the IHME’s “GBD Compare” online tool. Nevertheless, they show a trend that can be confirmed by examining the statistics and surveys published by other institutions: senior citizens are at high risk in road traffic – not only as car occupants, but especially as pedestrians and cyclists, as illustrated in Figure 5.
LOOKING AT SELECTED COUNTRIES OUTSIDE OF THE EU
According to the International Traffic Safety Data and Analysis Group (IRTAD), the number of 18 to 24-year-olds who died in road accidents in the countries that were analyzed dropped by 25 percent between 2010 and 2018, and the same figure dropped by 6.9 percent for 25 to 64-year-olds. The trend during this same period for senior citizens was the inverse of this: the number of over-65s who were fatally injured in accidents rose by around seven percent, while there was a 4.7 percent increase among over-75s.
One reason for this increase is the growing number of senior citizens in the population as a whole. Furthermore, senior citizens nowadays are often much more mobile than in previous decades, and continue to be active road users well into their later years. In 13 out of 31 countries with available data analyzed by IRTAD, for example, the data showed that citizens who were 75 or over had the highest mortality rate in 2018. This rate was highest in South Korea – at 29.7 traffic fatalities per 100,000 population. The national average for traffic fatalities there was 7.3 per 100,000 population. Overall, senior citizens accounted for 44.5 percent of all traffic fatalities in South Korea in 2018. Within this group, a dis-proportionately high number of those who were killed were pedestrians or cyclists.
A 2016 report on South Korea published by the OECD’s International Transport Forum listed a number of reasons why this particular country performed much worse in road safety when compared to other OECD nations. It appears that many pedestrians in South Korea cross the road without paying attention to traffic. When the pedestrians in question are senior citizens, they are more likely to die from the consequences of an accident than a younger person. Another problem is that crossings on wide roads take more time to cross, which increases the risk of an accident occurring after the pedestrian traffic light has turned red. Senior citizens are at a disadvantage here, as they generally walk more slowly than younger people. Combined with the supposedly reckless behavior of some road users, this places senior citizens at greater risk. This issue also applies to another Asian country: Japan. Older road users there are also by far the group at most risk of being involved in an accident. Senior citizens made up 57 percent of all road traffic fatalities in 2018. Most of the senior citizens killed in road traffic in Japan are pedestrians. According to the IHME, the same applies to several non-European countries, including Brazil, Chile and China.
In the USA, there are no particular anomalies in the data for senior citizens. As in many other countries, drivers in the 70+ age group have a higher accident rate per mile driven than middle-aged drivers. The rate of fatal road accidents per kilometer driven also increases rapidly between the ages of 70 and 74, and is highest for the 85+ age group. According to the National Highway Traffic Safety Administration (NHT-SA), there were a number of trends for the 65+ age group in the USA between 2009 and 2018. The most noteworthy of these was the fact that the number of fatal road accidents increased by 30 percent during this period, with the number of pedestrian fatalities even rising by 65 percent (74 percent for men and 49 percent for women). Although the number of fatal accidents among cyclists aged 65 or over is relatively low, it nonetheless increased by 86 percent. Across the population as a whole, the fatality rate for senior citizens aged 65 and higher was than that for the younger age groups. Most of the senior citizens who die in road accidents in the USA are car occupants. According to the IHME, the same applies to several other non-European countries, including Australia, Canada, and New Zealand.
SITUATION IN THE EU
In the European Union (EU 28), 25,082 people died in road accidents in 2018. Compared to the 35,315 fatalities in 2008, this was a decrease of 29 percent. Of those who died in 2018, 7,274 were at least 65 years old, which accounts for around 29 percent of all fatalities (Figure 8). In 2008, the number of fatalities for this group was 7,397 – just under 21 percent. The decline in absolute numbers for this age group during this period is merely five percent, and the percentage of the total traffic fatalities for which they accounted increased considerably (Figure 9). Between 2010 and 2018, the number of traffic fatalities dropped for almost allage groups – among 18 to 24-year-olds, the figure even fell by 43 percent. Conversely, in the 65+ age group, five percent more people died in road accidents in 2018 than in 2010. This could be one consequence of the population across the EU becoming older with each year that passes.
In 2018, around 512 million people lived in the EU (EU 28). 100 million of these – 20 percent – were aged 65 or older. In 2014, this share was only 18 percent (around 95 million of almost 508 million). In this respect, the demographic shift mentioned in the introduction is in part responsible for the slower decline in traffic fatalities among senior citizens. However, this group is disproportionately affected overall – the percentage of all traffic fatalities for which they account has increased more than the percentage of the population who fall into this age group. This calls for a more detailed analysis of the statistics. A closer inspection reveals that around 40 percent of the women killed in traffic were in the 65+ age group. For men, the share is merely around 24 percent. However, the reason for this is that the number of younger male road users is higher, as is their willingness to take risks. There are also noteworthy findings with regard to types of road user. For example, 47 percent of the pedestrians killed in road traffic were in the 65+ group. Although there are no exact figures for pedestrians broken down by age group and distance covered, it is unlikely that senior citizens represent anywhere near half of all pedestrians or pedestrian journeys.
The picture is just as clear for the numbers of cyclists who suffered fatal injuries in accidents, around 45 percent of whom are in the 65+ age group. When it comes to car occupants, however, just shy of 24 percent of all fatalities are in this age bracket. This makes unprotected road users a particularly significant group among senior citizens. A key factor in this is the higher level of vulnerability that comes with age – given an identical type of accident , the risk of suffering more severe or fatal injuries would be greater for senior citizens than for younger people. The healing process also takes longer, and often involves complications.
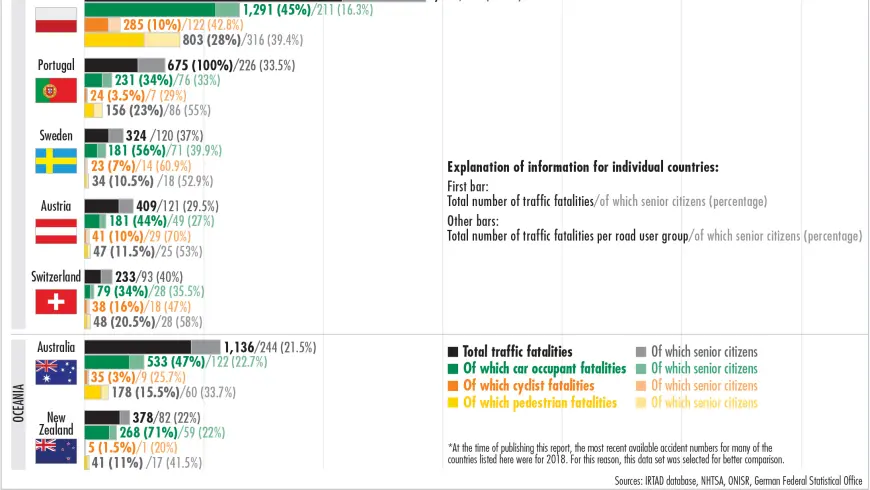
France is a good example in highlighting the accident risk for senior citizens during road use in the EU. According to the French Road Safety Ob-servatory (ONISR), 3,244 people in France were killed in road accidents in 2019 – 849 of whom were senior citizens (around 26 percent). This represents a slight increase of 0.8 percent compared to 2018. Overall, the number of traffic fatalities among senior citizens in France increased by an average of 1.2 percent per year between 2010 and 2019. In general, the severity of road accidents among senior citizens is much greater than for the other age groups. For people under 65, there were four fatalities per 100 injuries, whereas this figure was eight for people aged between 65 and 74, and 16 for people aged 75 or over. Overall, 54 percent of the senior citizens killed in road accidents in France were car occupants, 30 percent were pedestrians, and nine percent cyclists. Three quarters of all the older pedestrians who were killed were hit by cars driven by people younger than 65.
POSITIVE OVERALL TREND IN GERMANY
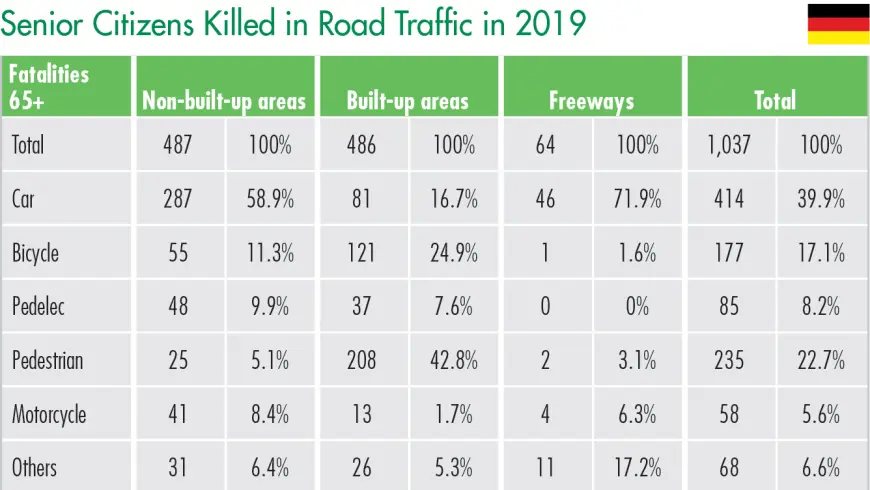
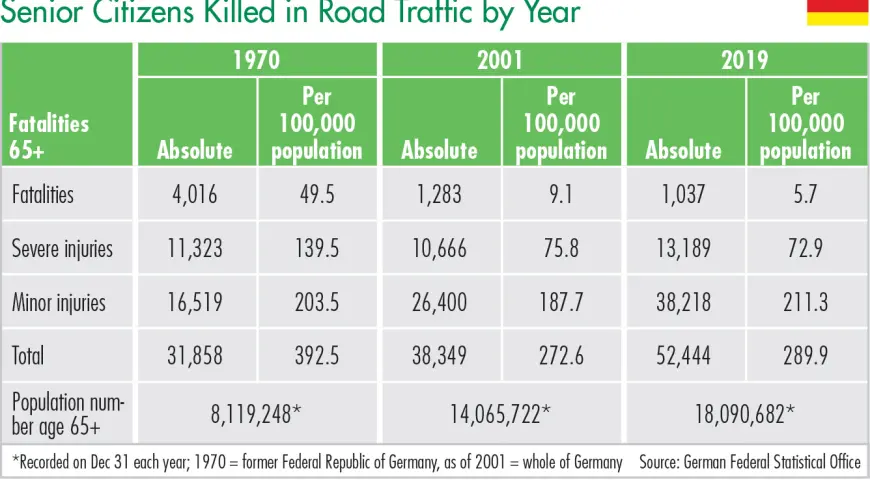
In Germany, the data show positive results for the 65+ age group, despite the increasing number of people in this group across the population as a whole. The number of people killed in road accidents has been in decline, as has the number of those severely injured – although the latter figure only applies when measured in relative terms, not absolute numbers. For those with minor injuries, on the other hand, there was an increase in both absolute numbers and relative terms. Of the 1,037 senior citizens killed on the roads, 486 died in built-up areas, 487 in non-built-up areas, and 64 on freeways. In built-up areas, however, around twice as many senior citizens suffered severe injuries than in non-built-up areas and on freeways combined. Most of the senior citizens killed or severely injured in built-up areas were pedestrians and cyclists; in non-built-up areas just under 60 percent of the senior citizens who were fatally injured were car occupants, as were around 65 percent of the severely injured.
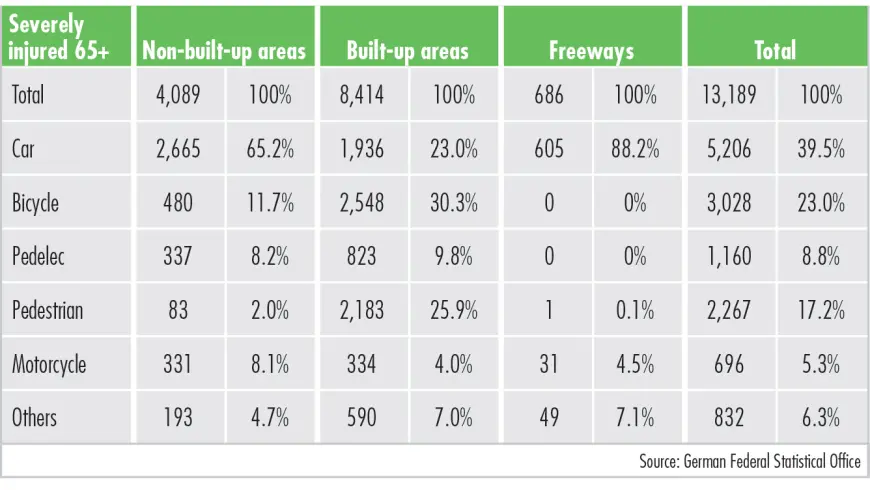
NUMBER OF SEVERE INJURIES ALSO INCREASES SIGNIFICANTLY
As mentioned above, the number of senior citizens killed varied drastically depending on the type of road use. For example, the absolute number of cyclists (including pedelec riders) aged 65 or over killed decreased by just 4 between 2001 and 2019, falling from 265 to 261, although the numbers had originally been dropping steadily until 2010, when they reached an all-time low of 188. Since then, the number has been increasing again. This represents a change from 1.9 to 1.4 for every 100,000 population in this age group. In relation to the number of senior citizens who died in accidents in the year in question, the percentage of these fatalities who were cyclists rose from 20.6 to 25.2. For pedestrians, there was a decline from 432 (2001) to 235 (2019). Accordingly, the number of pedestrians killed per 100,000 population for this age group dropped from 3.1 to 1.3. The percentage of all senior citizen fatalities accounted for by this group dropped from 33.7 to 22.7 percent.
This means that around half of the over-65s killed in road accidents were cyclists or pedestrians. In 2019, 57.3 percent of all cyclists killed were aged 65 or older; drilling down within the cyclist group to just the pedelec riders, the 65+ age group actually represented 72 percent. This age group also accounted for more than half of all pedestrian fatalities, at 56.3 percent. An even more nuanced analysis reveals that the risk increases even more when a road user reaches the age of 75. Among cyclists, 41.3 percent belonged to this age group alone, and the figure for pedelec riders was around half at 50.8 percent (for bikes excluding pedelecs, it was 39.1 percent).
Among pedestrians, 42.4 percent of all road fatalities were likewise aged 75 or over. In comparison to 2001, this represents an increase of 20.2 percent for cyclists, and an increase of 8.7 percent for pedestrians. The analysis shows that accident statistics in Germany are largely comparable to those for the EU as a whole. Focusing on implementing road safety measures for senior citizens aged 75 or over who fall within the unprotected groups (pedestrians and cyclists) could potentially reduce the overall number of these traffic fatalities. This approach is further substantiated by the dramatic increase that has been observed in the number of people being severely injured in road accidents. Whereas the share of severely injured pedestrians aged 65+ stood at 26.7 percent in 2001, by 2019 it had risen to 33.7 percent, while for cyclists it rose by around 10 percentage points to 27.6 percent.
DRIVER ERRORS AS THE CAUSE OF ACCIDENTS
Behavior during road use changes as people advance in age, and there are clear differences in the type of driver error that leads to accidents resulting in physical injury. This starts with the party to whom the recording police officers assign the primary fault of the road accident. If we take the number of car drivers in a certain age group who were involved in accidents that resulted in personal injury and compare this figure to the number of accidents caused by the age group, the results make for interesting reading. Young, inexperienced drivers and senior drivers represent particular risk groups. All of the age groups display values of over 50 percent, as they include accidents that involve just one car and no other road users – also known as single-vehicle accidents. Furthermore, several types of driver error can occur in a single accident. Up to the age of 65, men are much more likely than women to cause an accident due to driver error. After the age of 65, this difference levels out.
There are significant differences to be observed when analyzing the type of car driver errors that lead to accidents resulting in personal injury. Figures 14 to 16 show a selection of the key causes of accidents/key car driver error types assigned by the police who recorded the accidents. There are differences in terms of location: in non-built-up areas and on freeways, people cause more accidents in complex traffic situations as they advance in age – especially due to violations of rights of way. The impact of impaired driving abilities is also particularly high in more complex traffic situations. Such age-related impairments are also prevalent in incidents in built-up areas. Another statistic that stands out is the increase in driver errors in accidents involving cyclists and pedestrians, which only play an extremely minor role in non-built-up areas.
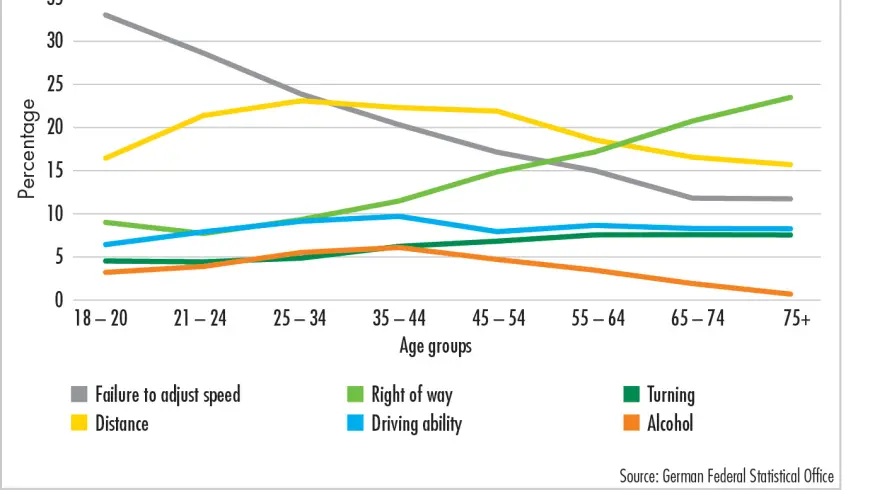
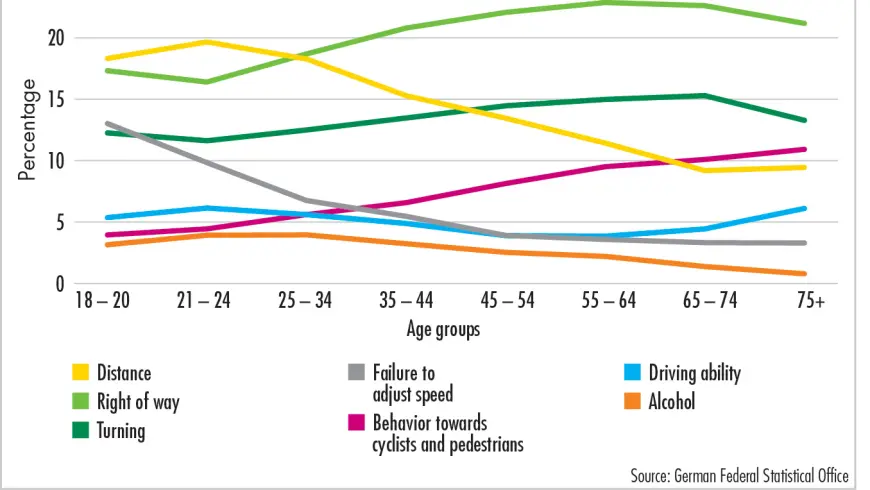
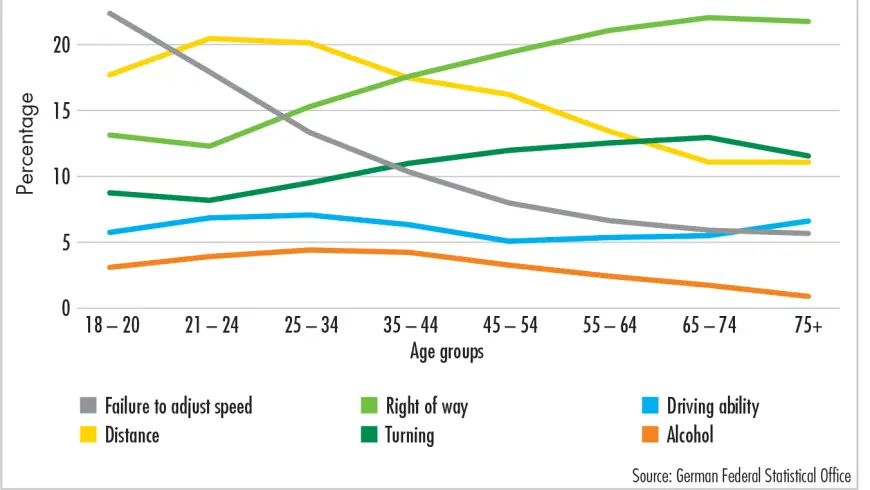
These data show that complex traffic situations need to be the primary starting point when devising measures for safer mobility for older car drivers. In addition to infrastructure optimization, in-vehicle assistance systems can also help with this issue. Ultimately, however, many acci-dents caused by violations of rights of way, that occur when turning, or that involve cyclists or pedestrians, are linked to physical or health-related limitations among the senior citizens responsible for the accidents. This issue is addressed in greater detail in the chapter on “The Human Factor” in this report.
VEHICLE AGE, DRIVER AGE AND ACCIDENT RISK
In 2019, the police recorded more than 355,000 cars in Germany as being involved in a road accident resulting in personal injury. This represents around 0.75 percent of all the cars registered in the country. Overall, there is very little fluctuation in this percentage based on the age of the vehicle in question. At first glance, increased vehicle age does not appear to affect the risk of being involved in an accident that results in physical injury.
COMPLEX TRAFFIC SITUATIONS SHOULD BE THE FOCAL POINT
However, this observation fails to account for mileage. Given that the average annual mileage decreases considerably as the age of the vehicle in question increases, this suggests that the accident risk is greater for older vehicles. This picture becomes even clearer when the main causes of accidents resulting in physical injury are considered together with the vehicle age. For example, 49.8 percent of accidents involving a car less than a year old were actually caused by this car. Viewed in isolation from mileage, this figure increases with increasing vehicle age, reaching 59.4 percent for vehicles that are twelve years old or more. If we include the driver’s age in this analysis, we can see that senior citizens once again cause the majority of accidents – a figure that increases to around 70 percent when the senior citizen in question is driving a vehicle that is at least twelve years old.
This analysis clearly shows that advances in vehicle technology have the potential to reduce the number of total accidents and the risk of accidents resulting in physical injury. These improvements benefit all age groups. However, the increase in the average age of the cars on the road is slowing the decrease in the number of traffic fatalities. The average age of all cars registered in Germany has been steadily increasing over the past 20 years, rising from 7.1 years in 2001 to 9.8 years at the start of 2021.
The fact that older car drivers score comparatively poorly in causing road accidents that result in physical injury is due a combination of several factors. In addition to the increasing physical limitations explored in the “The Human Factor” section of this report and the increased vulner-ability that comes with age, these factors also include the decrease in annual mileage as drivers get older and the resulting reduction in regular practice. Cars suitable for senior citizens that come with modern assistance systems that help the driver without overwhelming them can lower the risk of accidents caused by such factors. Furthermore, the improved level of occupant protection in modern cars reduces the risk of occupants being injured in case of an accident.
It is important to bear in mind that the number and type of motor vehicles currently on the roads cannot generally be used to draw any conclusions with regard to the mileage of said vehicles. Likewise, the ages of the drivers to whom the vehicles are registered is not a reliable indicator as to whether these people are the sole drivers of the vehicle in question. Instead, inclusion in accident statistics is based on mile-age in relation to the individual road categories (built-up area, non-built-up area, freeway), as well as on age-related factors for the drivers. Traffic in general involves road users who cause accidents due to their behavior or the condition of their vehicle. The other road users get caught up in the accident more or less by chance. In order to determine the correlation between the age of the ve-hicle, that of driver, and road use in cases involving cars, a new approach has been devised.
This approach is based on all of the accidents resulting in physical injury that involved at least one car. In order to minimize the influence of the aforementioned behavior-based parameters and registration-related factors, the approach only considers cars involved in accidents where the main fault for the accident lay with the other party. What type of road user the other party falls into is not relevant. fiis group is a very good representation of car-related trafic events. Dividing this group into different driver ages and vehicle ages confirms previous ?findings.
The graph shows that, across all driver age groups, the percentage of cars that are at least ten years old has increased between the periods 2005-2009 and 2015-2019. This increase was greatest among senior citizens – at 8.6 percentage points. The percentage of newer cars (up to three years old) being driven by the 18-34 age groups increased, but it remained almost level among 35 to 65-year-olds. For drivers aged 65+, this percentage actually decreased.
This means that the accident statistics corroborate the findings from other statistics: the percentage of older people who drive older cars is increasing disproportionately. As people get older, they are less likely to replace their vehicles, as their annual mileage decreases and they are more likely to take the stance that the vehicle “still works” and thus does not need replacing. As a result, driver assistance systems are only making their way into the vehicles of senior citizens relatively slowly.
The Facts at a Glance
- Taking an age group as a percentage of the population and considering it in relation to the frequency of accident involvement or the severity of injuries provides important indications of how relevant these statistics are within traffic events as a whole and for long-term changes.
- According to the Institute for Health Metrics and Evaluation (IHME) at the University of Washington in Seattle, the global number of 65 to 69-year-old road users killed in accidents increased by more than 65 percent between 1990 and 2019, rising from 39,000 to around 65,000. For the over-70s, the global rate increased by over 80 percent – from 82,000 to just under 150,000.
- According to the European Commission, the number of traffic fatalities in the EU decreased for almost all age groups between 2010 and 2018 – for 18 to 24-year-olds it even fell by 43 percent. Conversely, in the 65+ age group, five percent more people died in road accidents in 2018 than in 2010.
- Senior citizens are at a particularly high risk of suffering an accident when walking or riding a bike or pedelec.